Proposal Reports (Install Price) (Legacy)
![]()
Details
This page will describe the "Install Price" reports in SI 2017. There are three of these reports and they are named: Proposal (Install Price), Proposal With Images (Install Price), and Proposal With Large Images (Install Price).
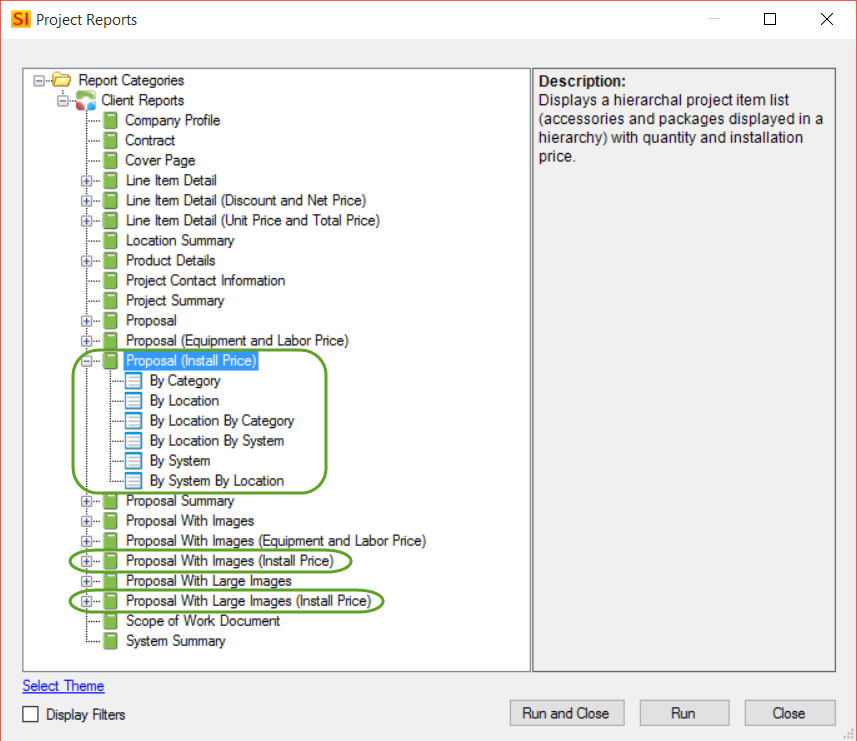
The only differences between these reports are whether images for Products display, and if so, what size the image is:
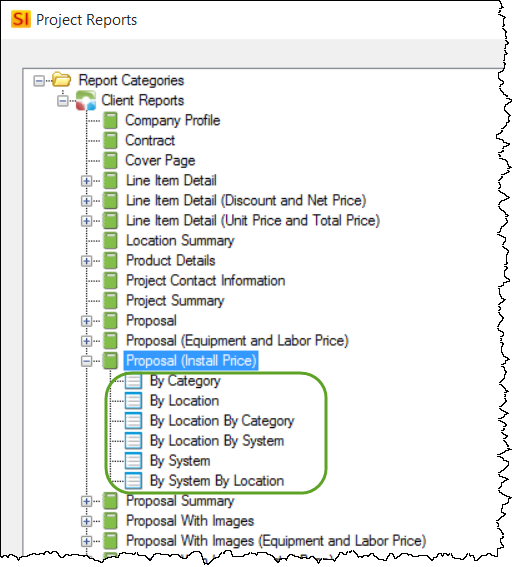
Proposal (Install Price):
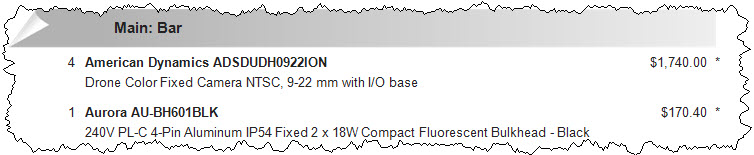
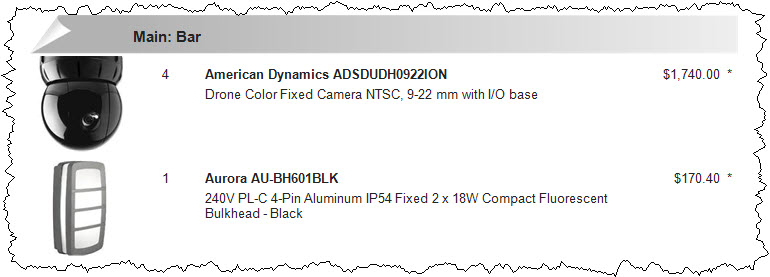
Proposal With Images (Install Price):

Proposal With Large Images (Install Price):
Accessories and Packages
Proposal reports are the only reports in SI 2017 that will display Accessories with their "parent" Item and they are the only reports that will display Packages with all Items grouped together. If for some reason you don't want to keep Accessories with the parent Item or if you don't want to show Packages in your Proposals, there are Report Settings for these.
Definitions
Proposals have the following default Report Definitions:
Proposals can have up to three levels of groupings. For example, you could create a Report Definition that groups "By Location By System By Category".
Layout and Fields
Cover Page
Proposals have a cover page that displays Client information (project name, name, address, etc.), your Company Information, and an Image.
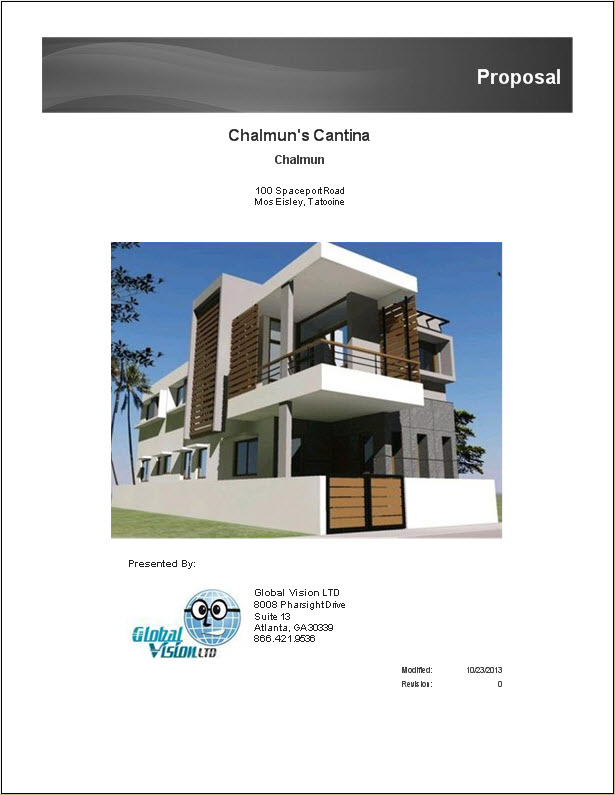
The header graphic can be changed via Report Themes.
The image that displays in the middle can be changed via a Report Setting.
Body
In the body of the report, there is a page header graphic and a group header graphic for the first grouping. These can be changed via Report Themes. In the image below, the report was run "By Location By System".
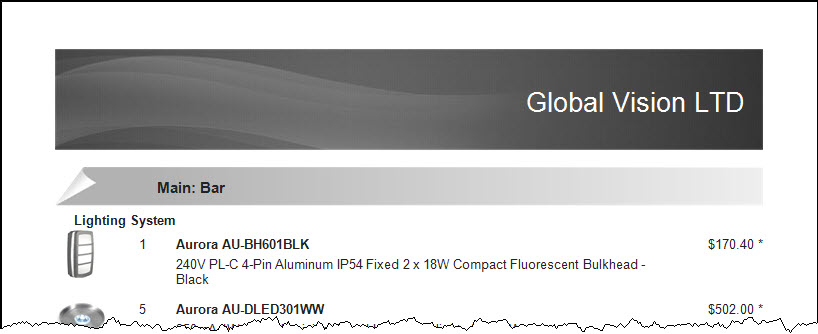
The fields that print for each item are: Image (depending on the report chosen), Quantity, Manufacturer, Model, Description, and Installation Price. Installation Price is the Price + Labor + any Price Adjustments.

Model and pricing can be turned off via settings in the Report Definition.
By default, Products and Labor Items display on these reports with their Price, which is different than our "non-Install Price" Proposal reports.
At the end of each grouping, there is a subtotal.In the image below, the report was run "By Location By System".
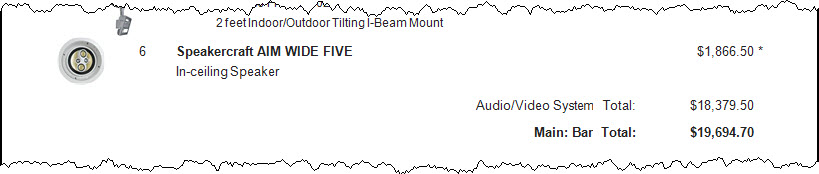
At the end of the last grouping there is a Project Subtotal.
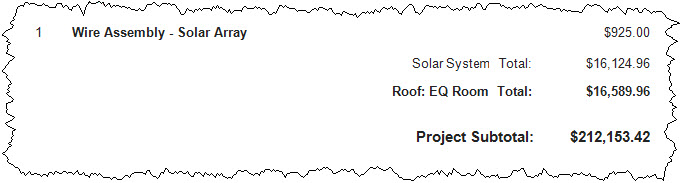
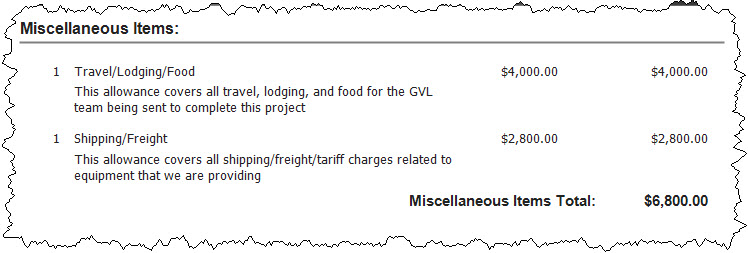
If you are using Miscellaneous Items they will list after the Project Subtotal:
Project Summary
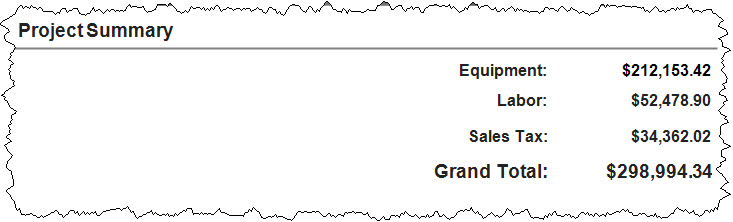
The last page of Proposal reports, by default, list the totals for Equipment, Labor, Tax, and then Grand Total.
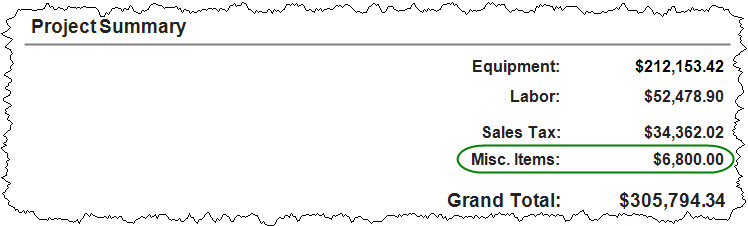
If you have Miscellaneous Items in the project, they will list after the Sales Tax line since these are not taxed:
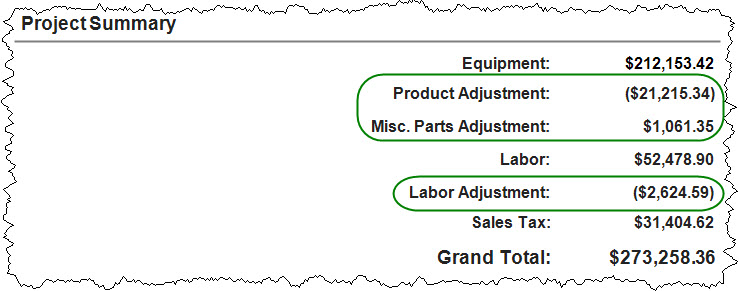
If you are using Price Adjustments, these will display in the Project Summary. You can change the wording of each of these fields via Report Settings.
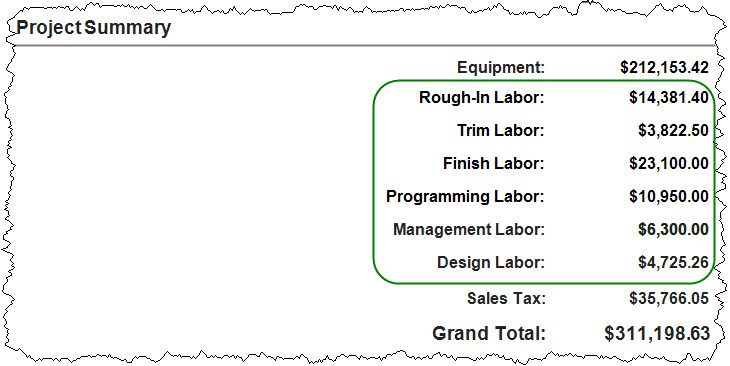
You can choose to break your labor out by Phase via a setting in the Report Definition. Each Phase will list on separate lines, and if using the Management and Design fields on your Phases, they will be combined into one line item each with the totals from each Phase.
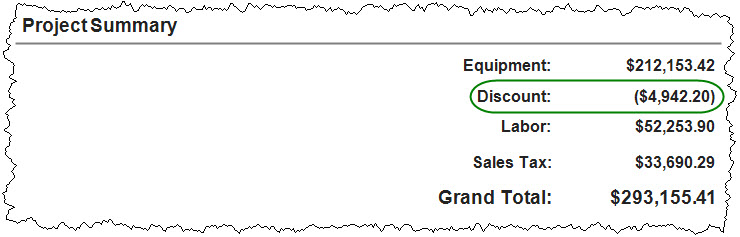
If you use the Discount field for Products within a Project, by default they will not show here in the Project Summary section. You can choose to display the discount here via a setting in the Report Definition. You can change the wording this field via Report Settings.
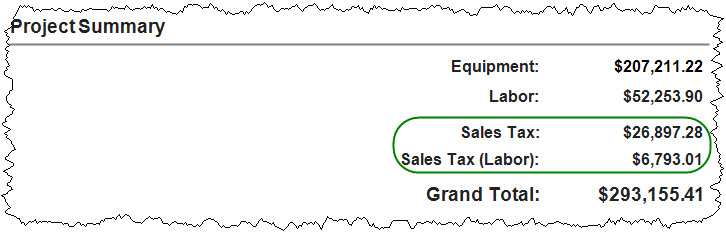
You can choose to separate Sales Tax from your Labor Sales Tax via the Report Settings. You can also change the wording of these fields via Report Settings.
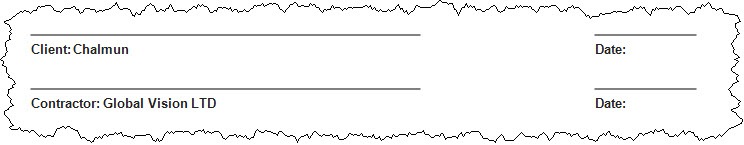
Below the Project Summary section, there are signature lines:
Page Footer
The Page footer contains the following fields: your Company name, the Project Name, Project Number, Date, and Page Number.

- © Copyright 2024 D-Tools