How do I represent wireless signals in Visio?
Question/Background
How do I represent wireless signals in Visio?
Answer
There are multiple ways that you can choose to represent wireless signals in Visio. You can either use line connectors which will not have any bearing on wire reports or you could use actual "wires" in SI to represent the signal if you want the connections to display on wire reports. When using either method you may want to use a specific color for the line or for the pattern of the line to vary from your actual wires, e.g. dashed or dotted vs. solid. Additionally you may want to differentiate the color or pattern for each type of wireless signal, e.g. WiFi, Bluetooth, ZigBee, etc.
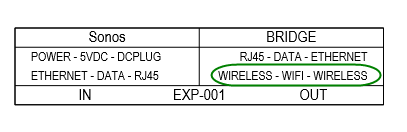
In these examples we will be connecting two Schematic shapes but you can use this method on any page style in Visio. Also, each Schematic shape shown in the examples needed to have an input or an output added to it to account for the wireless signals. You can add these I/Os however you wish but in these examples I used the following text:
Connector Shapes
Visio Connector Shape
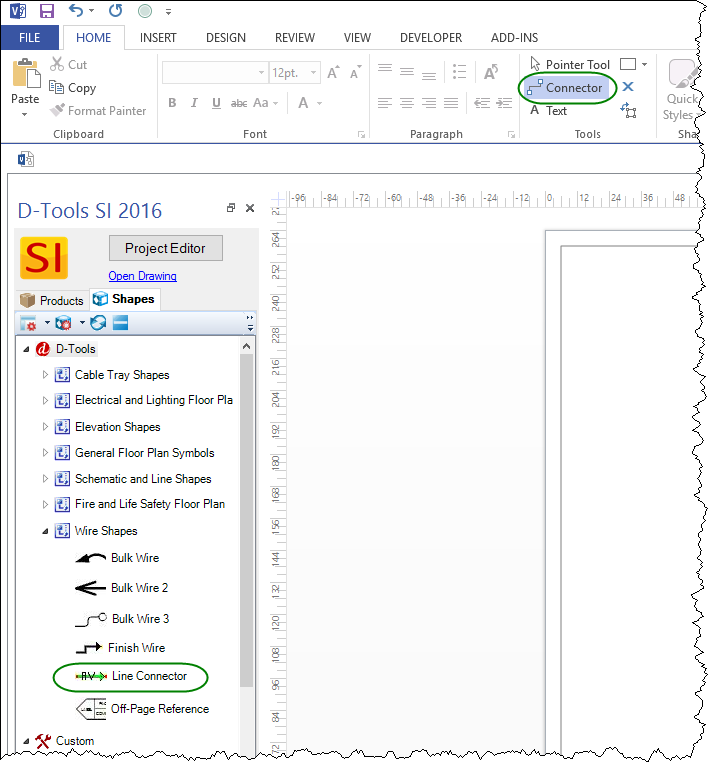
If you are not interested in these connections displaying on wire reports you can use the Connector shape in Visio or you can choose to use the Line Connector shape from your D-Tools library of shapes:
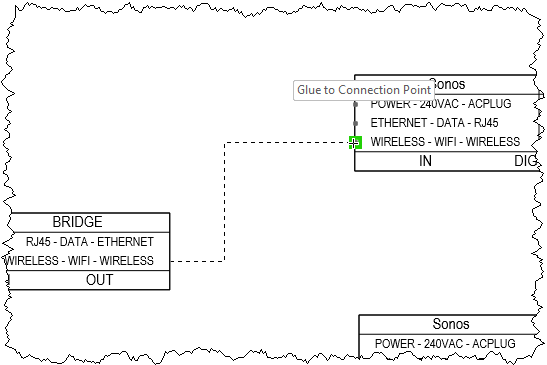
When using the Connector shape from Visio, you simply click on a connection point on one shape, hold the mouse left mouse button, then drag the connector to a connection point on the other shape and release the mouse button.
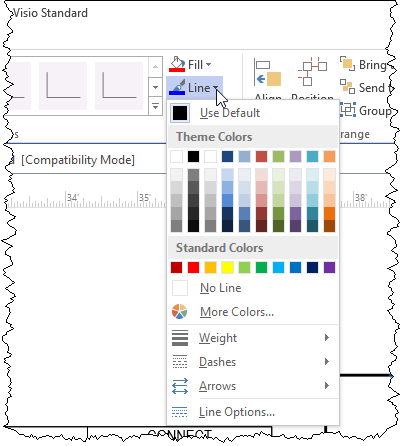
You can then use the Line options in Visio to change the color, pattern, weight, line ends, etc. to your liking.
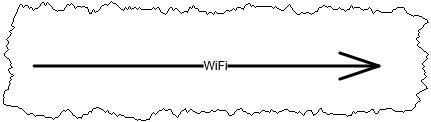
In this example I chose to make the color purple and changed it from a solid line to a dashed line. To add text to the line to designate what type of signal this is just double-click the line and type:
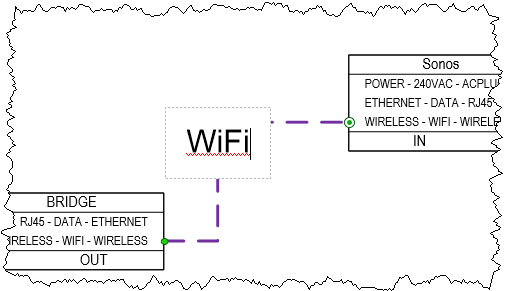
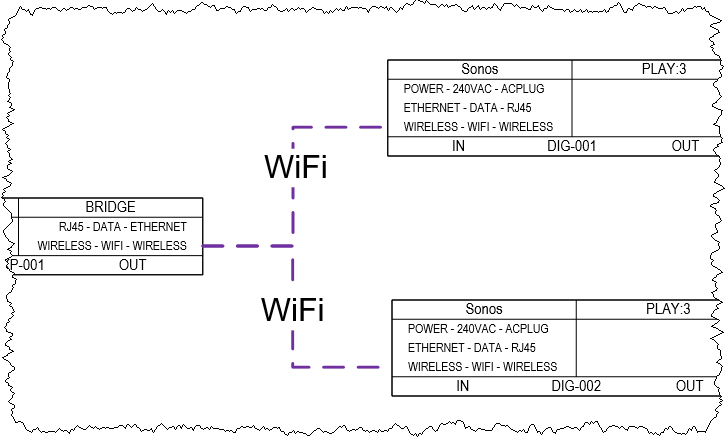
You can then copy and paste the line to make all needed connections:
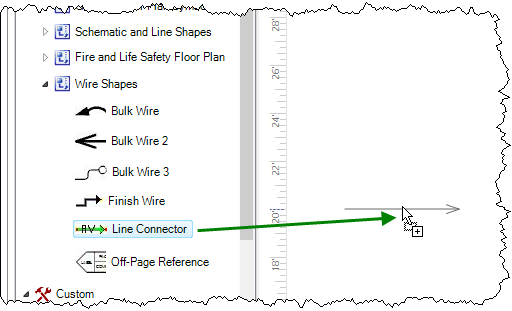
D-Tools Line Connector Shape
If you want to use the D-Tools Line Connector shape you simply drag it over to the page and drop it:
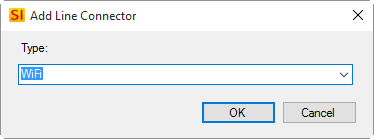
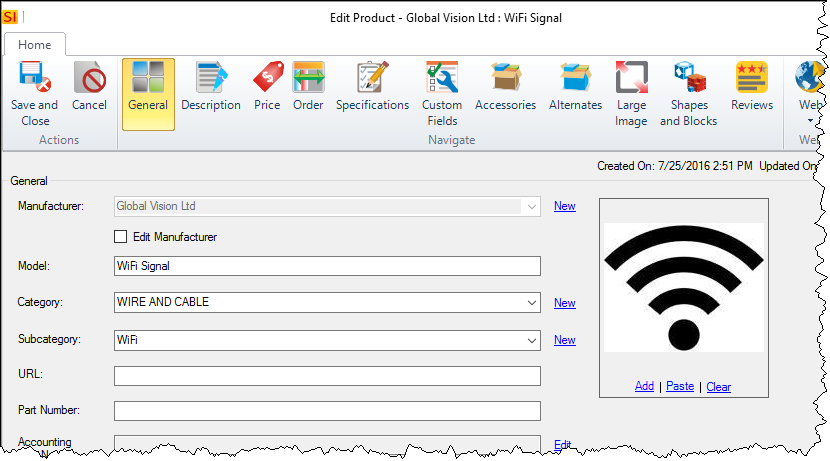
You will then be prompted to choose a "Type". Type is another word for Subcategory so will want to make sure that you add your wireless signals as Subcategories to your "Wire and Cable" Category:
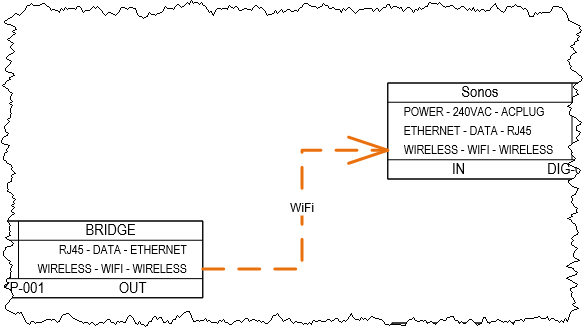
This text will display on the shape:
Then you just connect this to the two shapes and make and modifications you want via the Line options in Visio. In this example I left the arrow on the end of the shape but changed the color to orange and changed it to be a dashed line:
D-Tools Wire Shapes
If you want wireless signals to display on any of the Wire reports in SI you will need to set up the signals as a "fake" wire in your Catalog and use one of the D-Tools Wire Shapes vs. a line connector. What I mean by a fake wire is that it will have no dollar value or labor assigned to it, it will just be used to get a wire shape on the page. Below is an example of how I set up my fake wire:
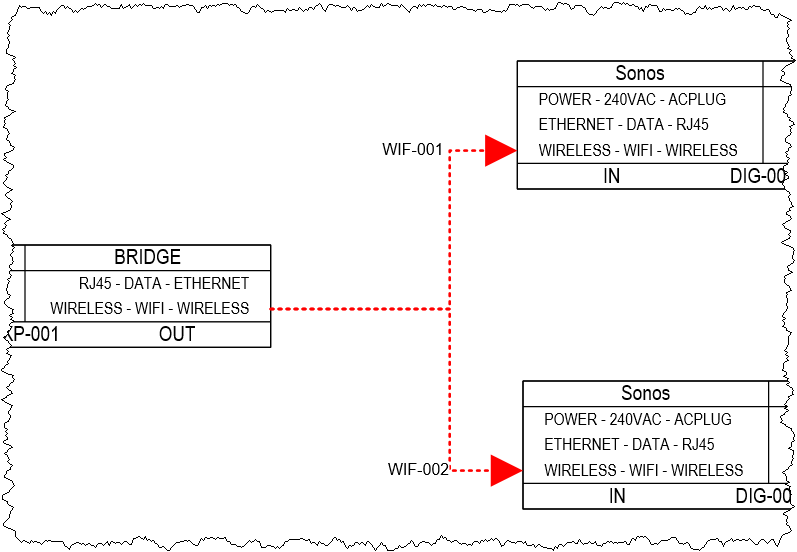
When this fake wire is added to a Schematic page in Visio, the "Finish Wire" shape will drop vs. a Line Connector shape. Notice that it is assigned a Component ID just like real wires and each signal will have a unique Component ID.
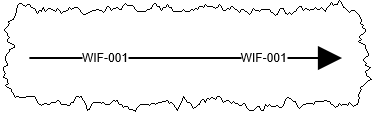
Shown below is this (and another) wire shape connected. This time I made the color red and used a dotted pattern. I also chose to show End Text only on the wire shapes:
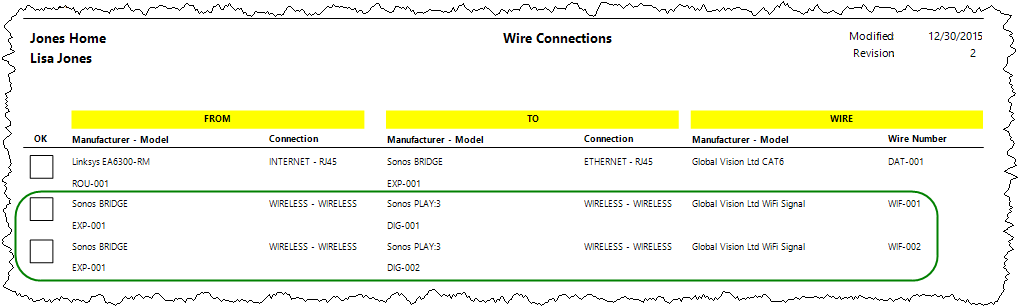
If you now run a wire report, these connection will display. Shown below is a Wire Connections report:
IP Address
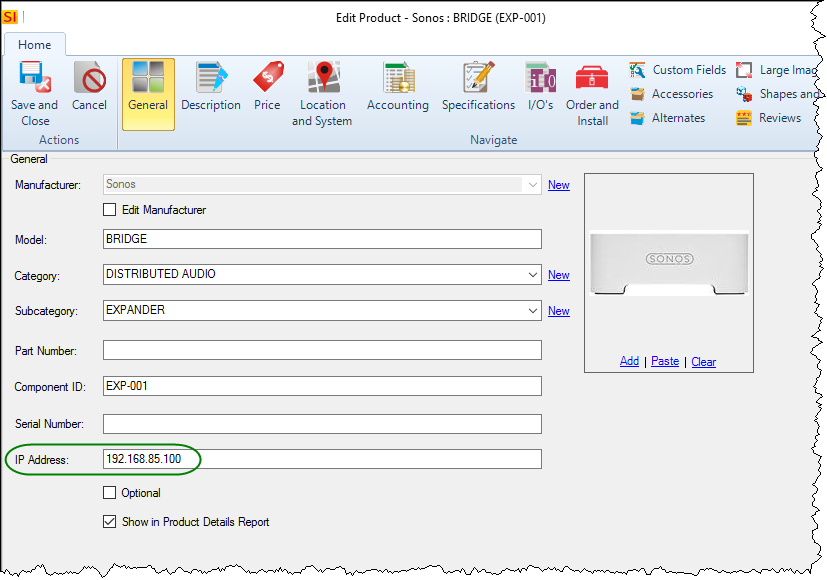
Whichever method you choose above, keep in mind that you can enter IP Addresses for the components using the wireless signal for reference:
- © Copyright 2024 D-Tools