Designer
Creating custom reports is for advanced users only. It is the sole responsibility of the user to debug any custom reports. However, for a great list of help options, check: http://downloads.d-tools.com/si5/documents/Custom_Reporting_Documents.htm
For a list of the XML tags available to you for customizing reports, as well as a list of the Report Utilities available to you, download and unzip this file. There are two files in this archive: Item.chm and ReportUtilities.chm.
The D-Tools Report Designer is based on ActiveReports for .Net 3.0 by Data Dynamics. For a complete user guide on this interface, see the ActiveReports User Guide.
Report Designer
To access the Report Designer, from the Reports tab select Tools -> Report Designer->Standard Reports/Order & Scheduling Reports.
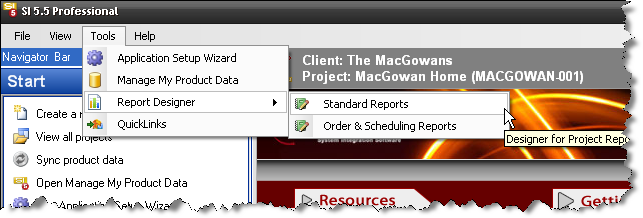
“Standard Reports” display on the Reports tab within the Navigator. “Orders and Scheduling Reports” will display on their respective tabs within the SI 5 Navigator.
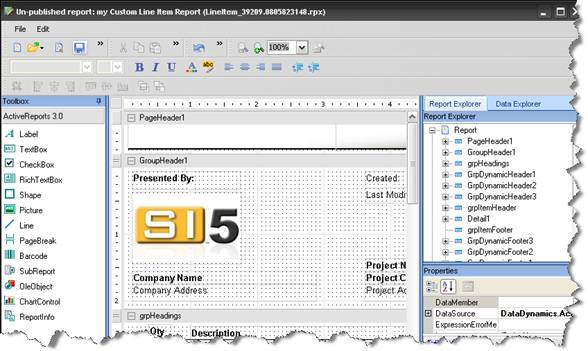
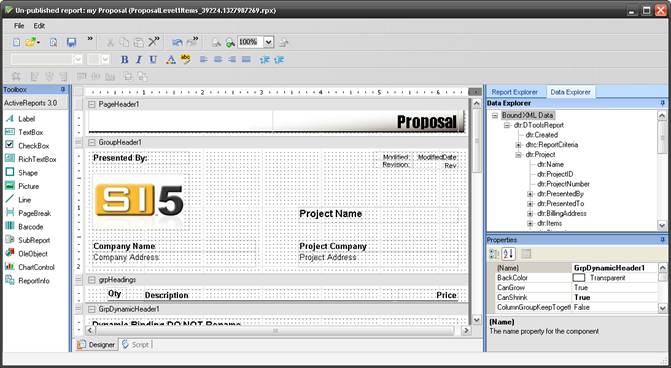
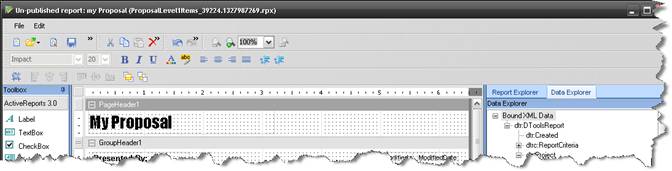
The Report Designer interface will open:

This interface consists of these parts:
- Menus and Toolbars (Selecting, saving, and publishing reports and formatting components of the report loaded into the designer.
- Control Toolbox – Controls available to be added to a report layout
- Report Designer Canvas (Design view of the report, sections and controls. This section also provides access to the reports scripting UI.)
- Report Explorer and Data Explorer Window (The Report Explorer allows users to see the sections and controls of a report in a tree format. The Data Explorer allows users to select fields from the XML structure against which the report is bound to.
- Properties Window (Lists all the modifiable properties for the selected object in the designer, be it a control, section, or the report itself)
Creating a Custom Report
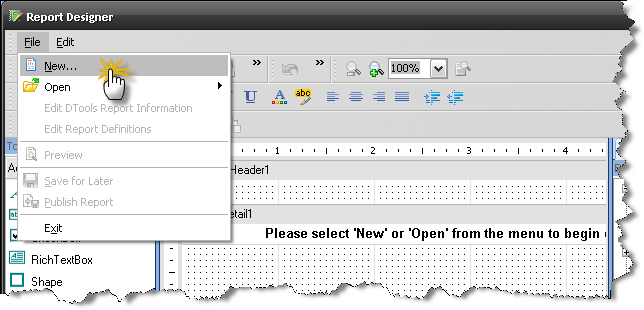
To create a new custom report, go to File->New.
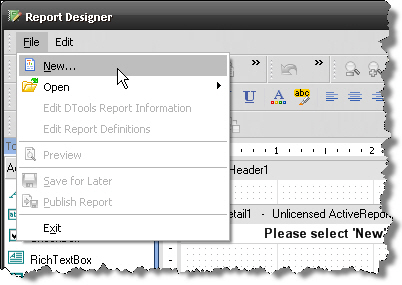
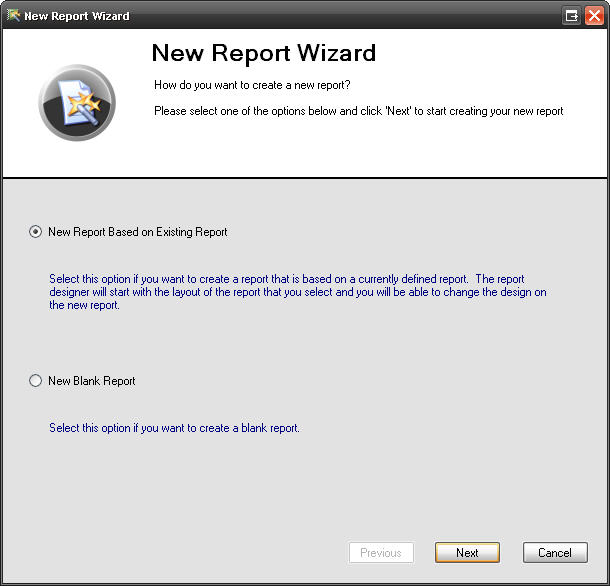
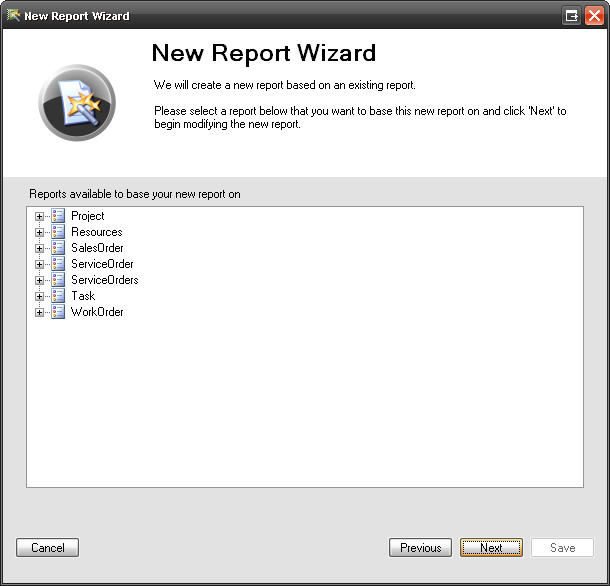
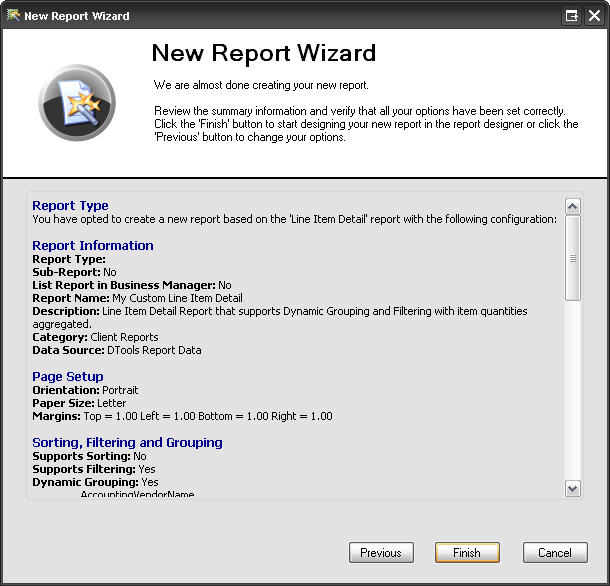
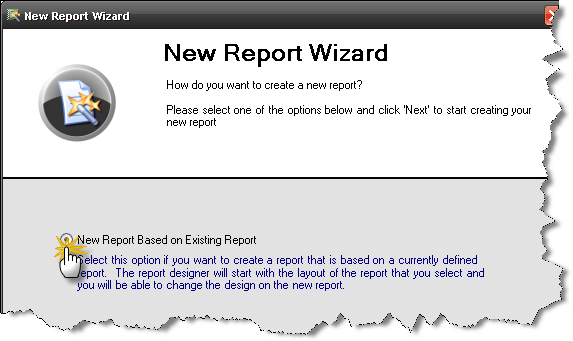
Select New Report Based on Existing Report to create a custom version of an existing report, or New Blank Report to create a report from scratch.
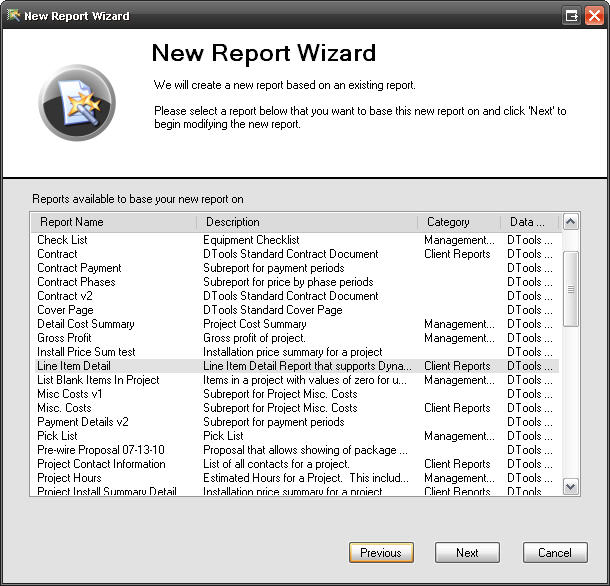
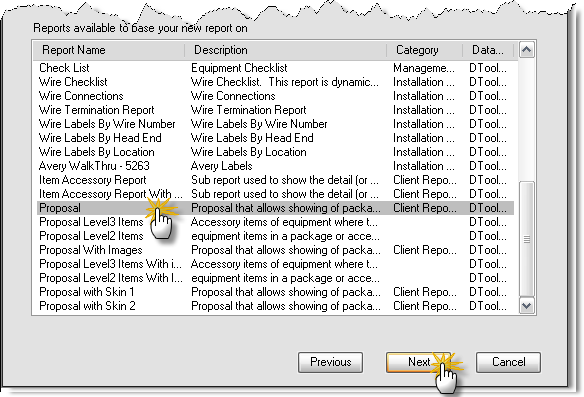
If you chose New Report Based on Existing Report, you should then select which report you wish to modify.
If you selected “Orders and Scheduling Reports” this screen will display Orders and Scheduling options. These Reports display in on their respective tabs within the SI 5 Navigator:
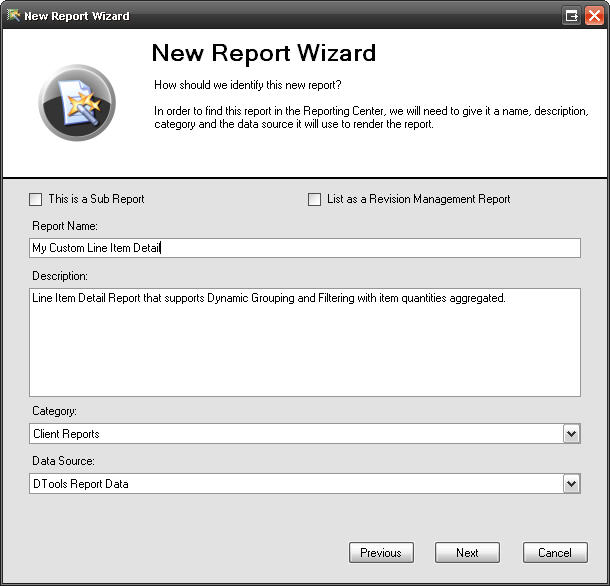
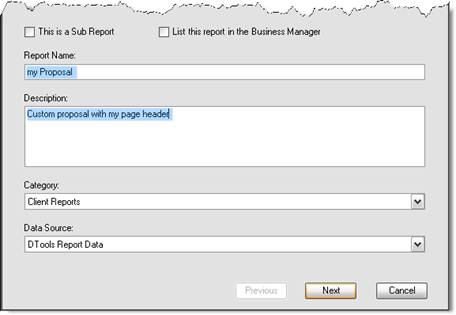
- Name the report (Required). Give the report a name that makes sense to you and will make the report easily discernable from other reports. If you are creating a report based on the standard Contract, it makes sense to NOT name the report “Contract”.
- Set the Description (Optional). While this is optional, it is an excellent way to provide a little more detail regarding the report. This information is displayed when the report is selected in the Report Details Window.
- Set the Category (Optional). Again, this is optional, but when the report is published, it will immediately be available in the Reports List Window in the selected category.
- Select a Datasource (Required). Currently, there is only a single Datasource available, ensure that it is selected if not already.
- Flag the Report as a “Sub Report”. Effectively all reports can be a sub report of another report, but checking this in the wizard implies that the report is only ever executed in the context of another report. Examples of reports that have this set are the Project Summary Detail (the summary info at the end of the Proposals), the Proposal Level 2 and 3 Items reports (these reports represent the child items (and grandchild items) of items in the Proposals.
- Flag the Report as “List as a Revision Management Report”. When this flag is checked, the report being created will only be visible in the Revision Management interface, not the main Reporting Center.
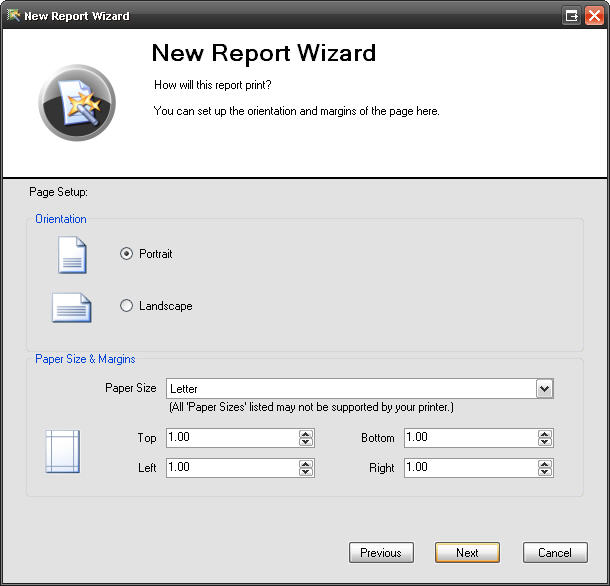
It is important to note that changing these settings DO NOT have a direct effect on the layout of the report in the designer. Changing the orientation or the margins will not automatically affect the “Width” of the report. By default, all standard reports (Letter paper size) that have the orientation set to “Portrait” have margins of one inch and a report canvas width of 6.5 inches. Changing the left and right margins to ½ inch each will not automatically change the width of the report canvas to 7.5 inches. The reasoning behind this is that reports can be designed to print in “columns”.
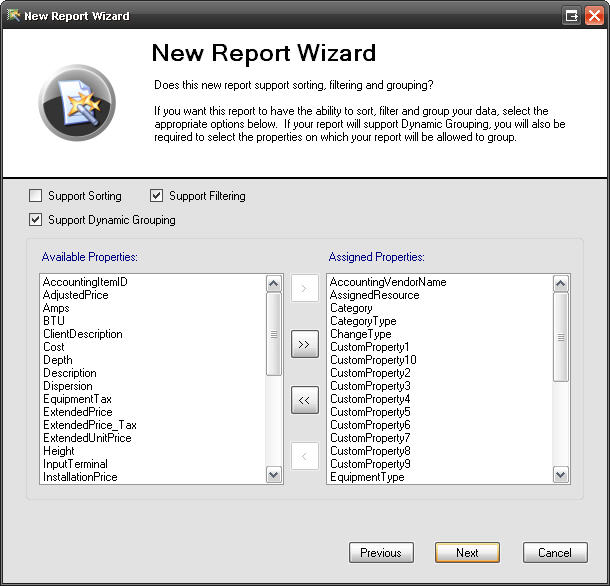
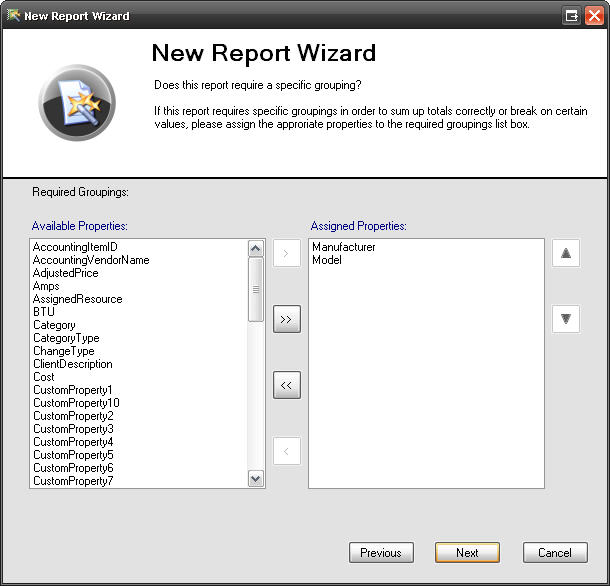
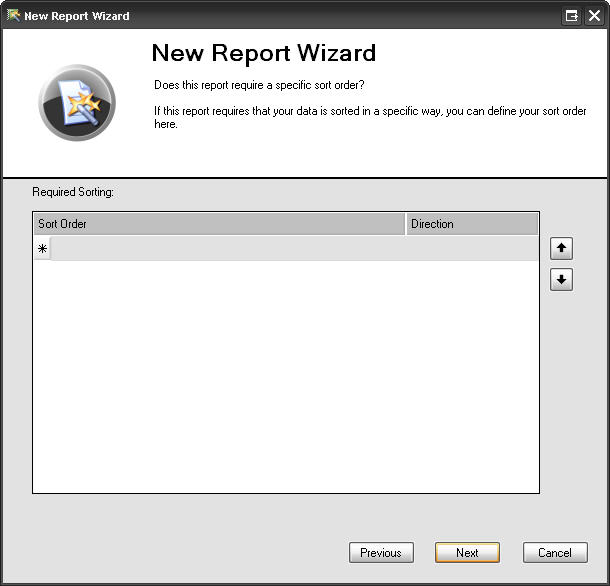
Note: Reports that do not iterate over items should not support Grouping, Sorting, or Filtering. These settings are tightly tied to items and only work when the items are the main data source of the report or a key sub report in the main report.
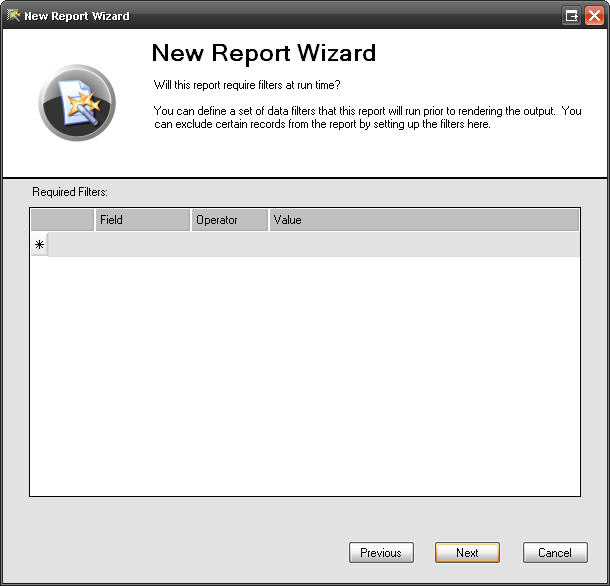
Step 7: Required Filters
- Name - a short string used as the key
- Description – User prompt displayed in the Report Definition UI.
- DataType – The value type of the parameter (String, Double, Integer, Boolean)
- Valid Values – Values that the user can select from in the UI. This allows for better control over what can be entered in the parameters value
- Default Value – The value selected by default in the UI if not previously set
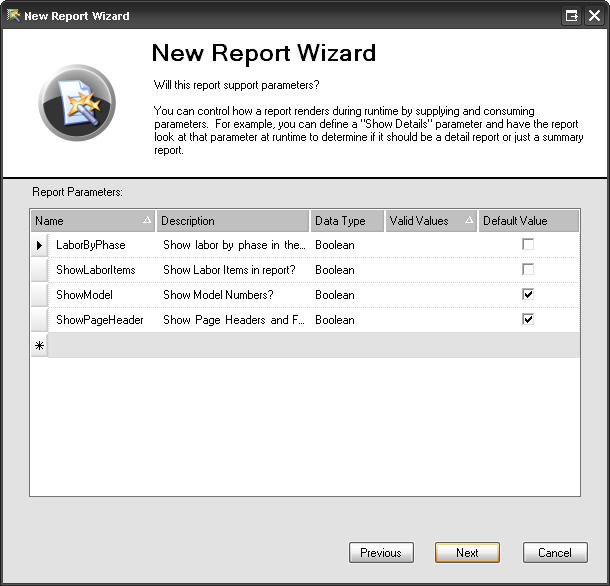
Note: While parameters are defined at this point, simply defining a parameter does not mean that it has any effect on the behavior of report. When the report is run, the value of parameter must be returned in script and used for the conditional behavior.
The report opens and is now an Unpublished Report that can be edited.
For detailed information about the components of an SI5 reports, see also:
File -> Open
Allows you to open a custom report that you have already created.
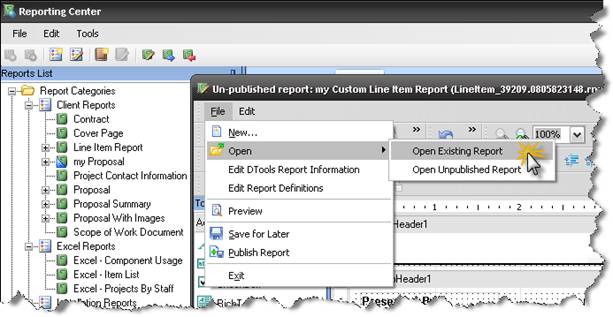
Existing reports are published custom reports that appear in your Reports List
Unpublished reports are custom reports that you are still working on. They do not appear in the reports list until you publish them
File -> Edit DTools Report Information
To change the report information you entered during the New Report Wizard, use File -> Edit D-Tools Report Information. This will re-open the wizard and allow you to change the settings, including report name, grouping/sorting/filtering settings, and other options.
File -> Edit Report Definitions
If you want to create some custom report definitions for your report, go to File -> Edit Report Definitions. Report definitions created here will appear in the Reports List beneath the report name.
File -> Preview
Allows you to preview your report vs. a sample project without having to publish the report or exit the report designer.
File -> Save for Later
Use File > Save to save an unpublished copy of your report for future editing. You will need to publish your report later if you wish to see it in your Reports List.
File -> Publish Report
This will publish the report you have open so that it will appear in your Reports List. Choose this when you are satisfied and want to start using your custom report. Note that this will close the report for editing.
There are a few additional options within the “Orders & Scheduling” Report Designer:
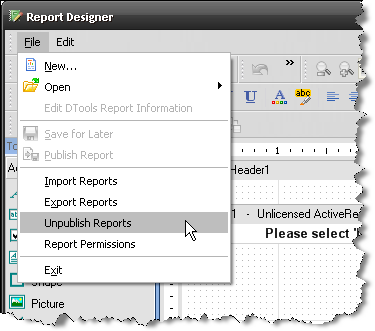
File->Unpublish Reports
This will remove a published report from the list of reports in their respective interfaces.
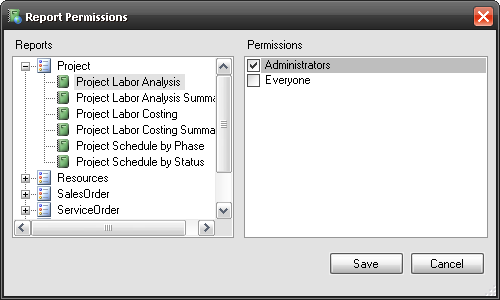
File->Report Permissions
Opens the following form. Here you can select reports and choose what Groups have access to the report. See the SI 5 Installation and Administration Guide for information on Groups.
Edit
The Edit menu has an assortment of commands which are helpful when editing your custom report: Undo, Redo, Cut, Copy, Paste, Delete, and Select All.
D-Tools XML Structure
D-Tools report data is based on an XML schema that is defined here:
http://www.d-tools.com/schemas/si5/reports/dtoolsreport.xsd
Custom Report Example
To give a simple example of how to customize a report, let’s change the page header on a proposal. Here’s how:
Step 1: Create a custom report based on an existing report
1) In the Reporting Center, go to Tools > Report Designer.
2) In the Report Designer, go to File > New…
3) Choose “New Report Based on Existing Report” and click Next
4) Select “Proposal” from the list and click Next
5) Name the report “my Proposal” and enter a description
6) Click ‘Next’ at all further screens until you get to ‘Finish’, then click that as well.
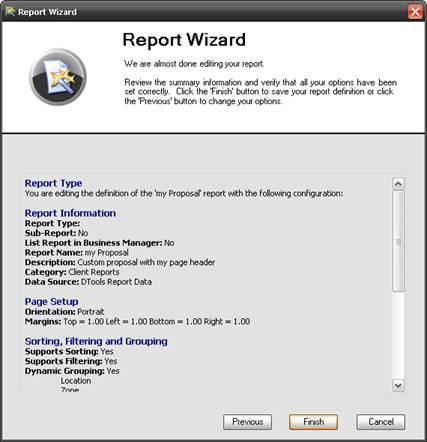
At this point the report has been created and can be edited.
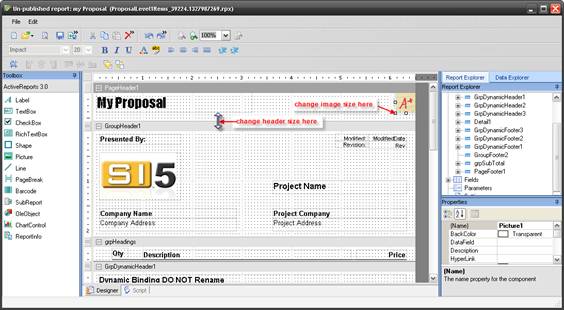
Step 2: Modify the Page Header
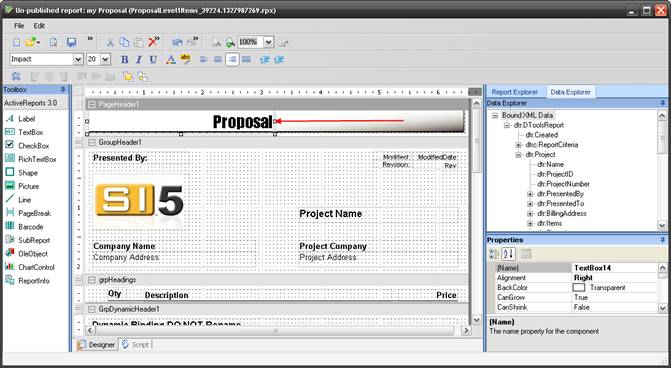
7) In the design pane, in the PageHeader1 section, click on the text that says “Proposal”.
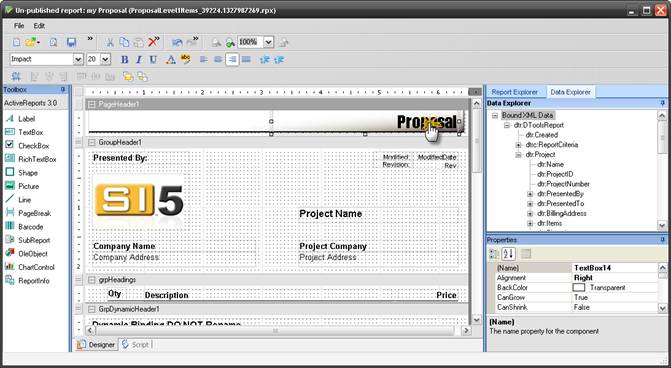
8) With the mouse, move this textbox (TextBox14) until it is aligned with the left side of the page
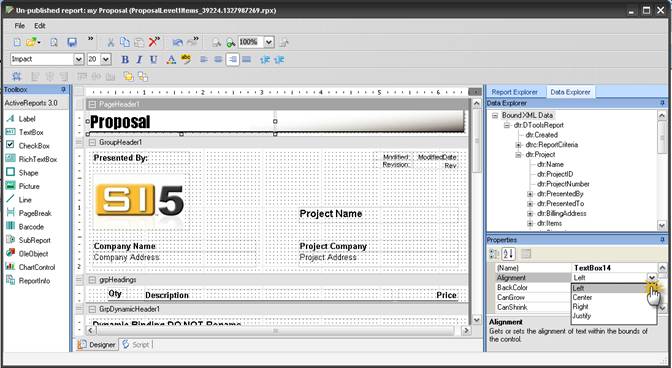
9) With the textbox still selected, go to the Properties window and set Alignment = Left
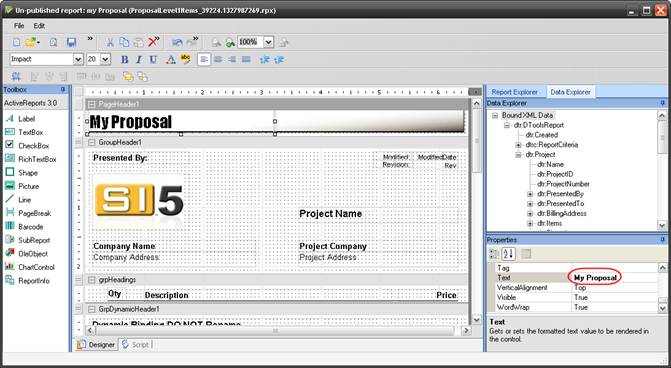
10)With the textbox still selected, go to the Properties window, scroll down to the Text property, and replace “Proposal” with “My Proposal”
11)To change the image in the header, first select it with the pointer
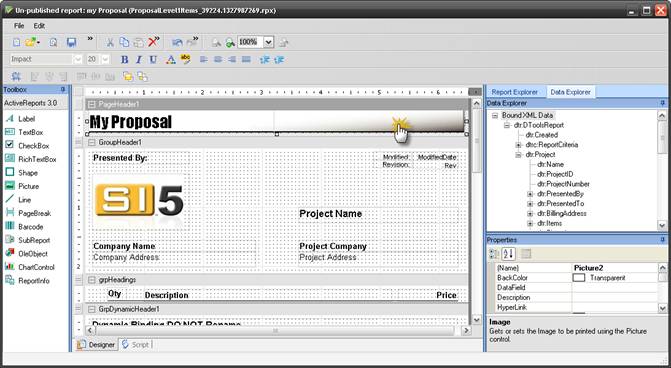
12)Now hit Delete to remove the image
13)To add a new image, drag and drop the Picture icon from the toolbox to the PageHeader1 section
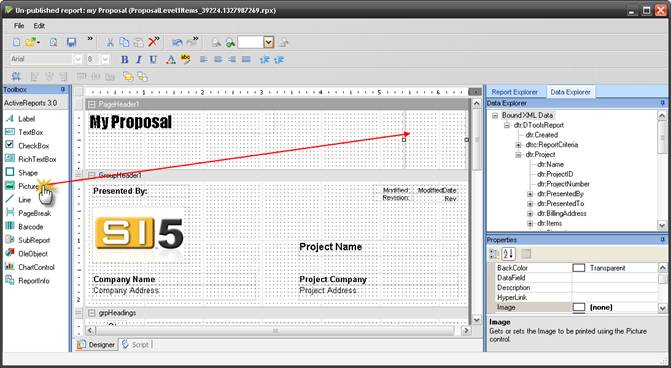
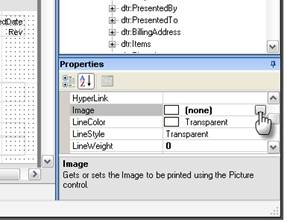
14)In the properties window, click on the image property and browse to the desired image file on your hard drive
15)At this point you will see the image in the design pane
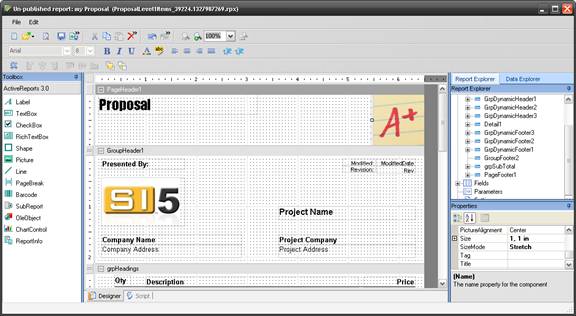
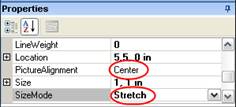
16)You may also need to set the SizeMode and Picture Alignment properties to see all of the picture
17)Resize the image using the handles on the image. You may need to adjust the size of the Header area before or after you do this.
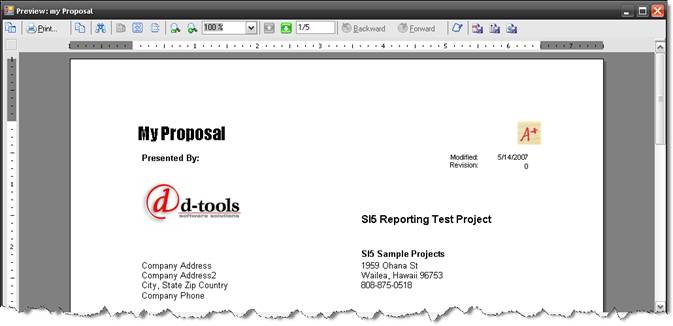
Step 3: Preview and Publish the Report
18)Go to File -> Preview to preview the report vs. a sample project. Close the window when done.
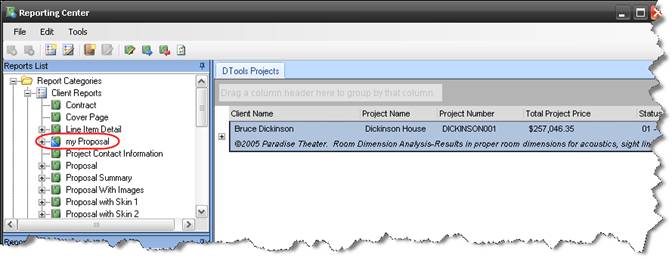
19)When satisfied, go to File -> Publish. Click ‘Yes’ at the prompt. You will be returned to the reporting center and your custom report will appear in your reports list.
- © Copyright 2024 D-Tools