Using the Mix and Margin Analysis Custom Report
Table of contents
Overview
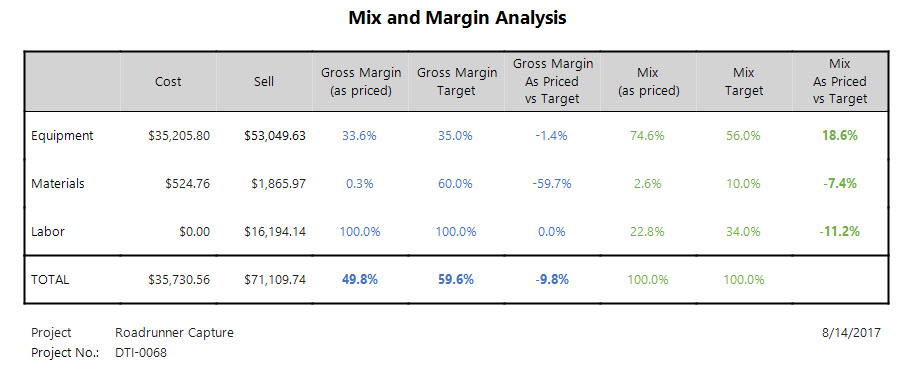
The D-Tools Professional Services Group worked closely with the Bravas Group to develop the Mix and Margin Analysis custom report. The report follows a Bravas prescription for dividing all project costs into three groups and then analyzing proposed margins vs. actual margins as well as comparing the proposed vs. actual mix of those groups.
The project cost breakdown used in this report works as follows:
- Labor - All labor associated with the project
- Materials - Miscellaneous Parts Adjustment plus all items in the following categories:
- Wire and Cable (standard SI category)
- Interconnects (standard SI category)
- Install Parts* (custom SI category)
- Equipment - All non-labor items not included in Materials
*Install Parts can be defined as project items other than wire and interconnects that are non-inventory items (e.g. wire hangers, brackets, etc.)
Target margins are hard coded in the report as follows:
- Equipment - 35%
- Materials - 60%
- Labor - 100% (labor cost is not included in the calculations per Bravas Group)
Mix targets are configurable using Report Definitions. The default values are:
- Equipment - 56%
- Materials - 10%
- Labor - 34%
Using the Solution
Download and Install the Report
- Download the report here: Mix-and-Margin-Analysis.dtr
- In SI 2017, navigate to Start - Reports - Manage Reports.
- From the Report Explorer, click Import - File.
- Browse to the downloaded file and select it. Click Open. The report will be imported and can be found in Management Reports.
Adjusting the Mix Targets
Perform the following steps to set your own mix targets and have those targets be the default when you run this report.
- From any SI interface where the Reports menu is available, navigate to Management Reports.
- Find the Mix and Margin Analysis report, right-click on it and select New - Report Definition.
- The Report Definition window opens. Type a description for the Report Definition.
- Click the Parameters tab.
- Type a percentage for each parameter and make sure the values add up to 100%. The report will not run otherwise.
- At the bottom of the window, check the Default Report Criteria box.
- Click Save. Now the report will use your mix targets by default.
- © Copyright 2024 D-Tools